The Power of Technical Indicators: Your Tool for Informed Trading Decisions
Technical analysis indicators are an integral part of the toolbox for many financial market participants. These powerful mathematical tools are designed to provide insights into market trends and price patterns, offering a crucial edge in the fast-paced world of investing and trading. This in-depth guide from Investora will take you on a journey through the intricacies of technical indicators, elucidating their definitions, functions, various types, and practical examples. We aim to equip you with knowledge that can be instrumental in your financial market adventures, whether you're a seasoned trader or a newcomer dipping your toes into the vast sea of financial analysis.
Unveiling the Magic of Technical Indicators:
Technical Indicators, in the realm of technical analysis, are algorithmically derived signals. They consider variables like price, volume, and open interest of a security or contract. These data-driven signals are avidly utilized by traders for predicting future price movements, assisting them in making informed decisions about when to enter or exit a trade.
You might be asking, "What makes these indicators tick?" These are not arcane rituals or magic formulas but rather data-based tools. By crunching historical market data, these indicators can discern trends and patterns that might remain hidden from the naked eye. Some well-known technical indicators you might have come across include the Relative Strength Index (RSI), Money Flow Index (MFI), Stochastics, Moving Average Convergence Divergence (MACD), and Bollinger Bands.
Interesting Fact: The concept of technical indicators originated from stock market data, but they are now used in various other financial markets, including forex and commodities.
From the Shadows into the Limelight: How Technical Indicators Operate
Technical analysis - a trading approach used to evaluate investments and spot trading opportunities by assessing statistical trends sourced from trading activity such as price movement and volume. This approach may seem at odds with the method of fundamental analysts who analyze a security's intrinsic value via financial and economic data. However, the two are not mutually exclusive and can even be complimentary. Technical analysts or 'chartists' apply analytical charting tools to gauge a security’s strength or weakness based on price movements, trading signals, and patterns.
This method can be applied to an array of securities with historical trading data, including stocks, futures, commodities, fixed-income securities, currencies, and more. It's important to note that although we'll often use stocks as examples in this guide, these concepts are universally applicable. Particularly, commodities and forex markets lean heavily on technical analysis due to their emphasis on short-term price movements.
While fundamental analysis revolves around a company's financial health (earnings, revenue, or profit margins), technical indicators hone in on historical trading data like price, volume, and open interest. This approach appeals to active traders aiming to capitalize on short-term price fluctuations. However, it is not uncommon for long-term investors to leverage technical indicators to identify opportune moments for entering or exiting positions.
Remember: Different securities may respond differently to technical indicators due to the inherent characteristics of their respective markets.
Tip: Always consider the market context when interpreting technical indicators.
Diving Deeper: Classification of Technical Indicators
Technical indicators can essentially be divided into two core types:
- Overlays: These are technical indicators that share the same scale as prices and are superimposed on the price chart of a stock. Familiar examples encompass moving averages and Bollinger Bands.
- Oscillators: These indicators swing or 'oscillate' between a local minimum and maximum and are plotted either above or below a price chart. Some well-known oscillators include the stochastic oscillator, MACD, and RSI.
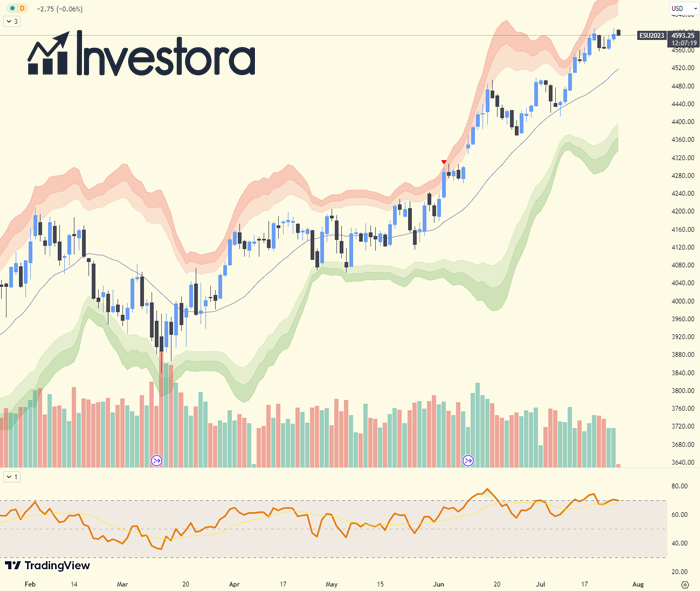
With a plethora of technical indicators at their disposal, traders need to cherry-pick the ones that best fit their trading style and strategies. It's crucial to understand the inner workings of the selected indicators to make the most out of them. Some traders blend technical indicators with other, more subjective forms of technical analysis, like chart patterns, to generate trade ideas. Owing to their quantitative nature, technical indicators can also be seamlessly integrated into automated trading systems.
Engaging with technical indicators can seem daunting at first. However, with time and experience, they can become reliable allies in your trading journey, providing invaluable insights that can augment your decision-making process.
The Path Ahead: Building a Strategy
With a multitude of technical indicators available, it's crucial for traders to identify those best suited to their trading strategy and style. Having a sound understanding of these indicators and how they function is key. They can then be mixed with other types of technical analysis or even fundamental analysis to develop a well-rounded trading strategy.
For instance, traders might combine Moving Averages with the RSI. When the price crosses the moving average, it could be a potential signal, which could then be confirmed or refuted by the RSI. This type of multi-indicator strategy can help filter out false signals and increase the robustness of the trading strategy.
Remember, technical indicators aren't infallible – they are tools to help inform trading decisions, not to make decisions for you. Always use technical indicators in conjunction with other tools and information, including market news and economic events.
Important: Choosing the right indicators that align with your trading strategy is crucial for success.
Incorporating Indicators in Automated Trading Systems
Technical indicators are not only useful for manual trading but also play a crucial role in automated trading systems. Automated systems, or trading bots, can be programmed to make trades based on the signals generated by technical indicators. This capability opens up a new world of possibilities for traders, allowing them to execute trades 24/7 based on their selected criteria.
Interesting Fact: Automated trading systems have been used since the 1970s, with the advent of electronic trading platforms.
Technical Indicators Frequently Asked Questions
What are the most reliable technical analysis indicators?
There's no one-size-fits-all answer to this, as the reliability of an indicator can vary based on the trader's strategy and the market conditions. However, commonly trusted indicators include Moving Averages, MACD, RSI, Bollinger Bands, and the Stochastic Oscillator.
How do I set up technical analysis indicators in TradingView?
In TradingView, you can add indicators to your chart by clicking on the 'Indicators' button at the top of the screen. Then, simply search for the indicator you want to add, select it, and it will appear on your chart.
How can technical indicators be used for long-term investing?
While technical indicators are often associated with short-term trading, they can also provide valuable insights for long-term investors. For instance, indicators like Moving Averages can help identify long-term trends, while oscillators like RSI can signal overbought or oversold conditions that might indicate a reversal in trend.
Can technical indicators predict future market movements?
Technical indicators cannot predict future market movements with absolute certainty. They are tools that can help traders identify potential trends and signals based on historical data, but they should always be used in conjunction with other forms of analysis and market information.
Which technical indicators are best for beginners?
Simple Moving Averages (SMA), Relative Strength Index (RSI), and MACD are often recommended for beginners due to their simplicity and effectiveness. However, each trader should spend time learning and understanding a range of indicators to find out which ones they find most useful.
- Share this article

