
Moving Average Convergence/Divergence (MACD) Indicator: Guide for Traders
Dive into the realm of financial indicators with this comprehensive and insightful analysis of the Moving Average Convergence/Divergence (MACD) indicator. An indispensable tool in any trader's arsenal, the MACD indicator provides important signals about market trends and potential reversals, empowering you to make more informed trading decisions.
This article from Investora offers an in-depth exploration of the MACD, detailing its calculation formula, illustrative examples of its use, and a balanced view of its limitations. As we dissect this vital tool, you'll find nuggets of wisdom to bolster your trading strategies and maximize your financial gains.
The MACD Indicator Unveiled
In the dynamic world of trading, the MACD is an invaluable ally for tracking the momentum and trend of a security's price. At its core, the MACD is a trend-following momentum indicator, revealing the relationship between two exponential moving averages (EMAs) of a security's price. The beauty of MACD lies in its simplicity: it is calculated by subtracting the 26-period EMA from the 12-period EMA. This result is known as the MACD line.
An auxiliary component of the MACD is the signal line, which is a nine-day EMA of the MACD line. This line is superimposed on the MACD line and serves as a trigger for buy or sell signals. When the MACD line soars above the signal line, it is typically seen as a cue for traders to buy the security. Conversely, when the MACD line dips below the signal line, it's usually a signal to sell or short the security.
While the interpretation of MACD indicators can vary, common methods include crossovers, divergences, and swift rises or falls. These diverse interpretations add to the versatility of the MACD, making it a preferred choice for many traders.
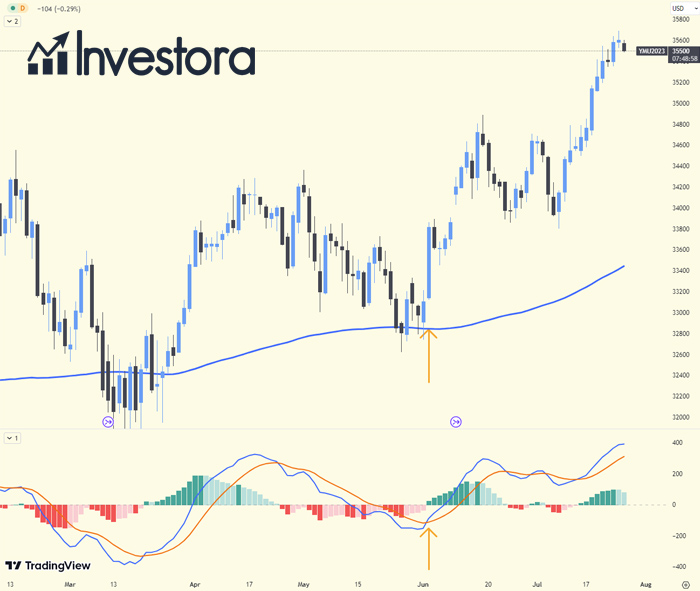
Tip: Look for the crossover of the MACD line and the signal line as a potential buy or sell signal.
Key Highlights of the MACD Indicator
The MACD is a powerhouse of a tool, packed with useful features for daily trading. Here are some key takeaways:
- MACD Line Calculation: The MACD line is derived from subtracting the 26-period EMA from the 12-period EMA. The signal line, on the other hand, is a nine-period EMA of the MACD line.
- Best Use Case: The MACD finds its optimal use in daily trading periods, where the standard settings are 26/12/9 days.
- Technical Signals: The MACD line crossing above the signal line hints at a buy signal, while a fall below signals a sell.
- Overbought/Oversold Indicator: The MACD helps discern if a security is overbought or oversold, alerting traders to the strength of a price movement and potential price reversals.
- Divergence Detection: The MACD can identify bullish/bearish divergences, such as when a new price high isn't confirmed by a new high in MACD, suggesting potential reversals.
After a signal line crossover, it is generally prudent to wait for about three to four days to confirm that the movement isn't false.
Remember: The MACD helps traders identify potential buy/sell signals, detect if a security is overbought or oversold, and identify bullish/bearish divergences.
The Mathematics Behind MACD
To truly grasp the power of the MACD, one must understand the formula that fuels it:
MACD = 12-Period EMA - 26-Period EMA
The MACD is essentially the difference between the long-term EMA (26 periods) and the short-term EMA (12 periods). The EMAs prioritize recent data points, assigning them greater weight and significance.
Tip: Understanding the calculation behind MACD can provide a deeper comprehension of its functioning.
Gaining Insights from the MACD
The MACD presents a treasure trove of insights for the discerning trader. For instance, when the 12-period EMA is above the 26-period EMA, the MACD has a positive value. If the 12-period EMA falls below the 26-period EMA, the MACD takes on a negative value.
The MACD can also be visualized with a histogram that represents the gap between the MACD and its signal line. If the MACD is above the signal line, the histogram will be above the baseline, indicating bullish momentum. Conversely, if the MACD is below the signal line, the histogram will be below the baseline, suggesting bearish momentum.
Important: The MACD can indicate bullish or bearish momentum through its value and histogram
MACD in Comparison with Relative Strength Index (RSI)
The MACD and the Relative Strength Index (RSI) are both vital indicators in trading, albeit with different features. While the RSI signals overbought or oversold conditions relative to recent price levels, the MACD lines do not have fixed overbought/oversold levels. Instead, they function on a relative basis, requiring traders to compare the level and direction of the MACD/signal lines with previous price movements.
Remember: While RSI signals overbought or oversold conditions, the MACD functions on a relative basis, comparing current levels with previous price movements.
Limitations of MACD and The Importance of Confirmation
Like any tool, the MACD has its limitations. It can often produce false positives, suggesting a potential reversal that doesn't happen. It may also fail to predict some actual price reversals. To mitigate this, traders can seek confirmation from trend-following indicators, such as the Directional Movement Index (DMI) system and the Average Directional Index (ADX).
While the MACD might indicate a bearish divergence, the ADX could reveal a trend higher, cautioning against a bearish trade based solely on the MACD signal. Conversely, if the MACD shows a bearish crossover, the ADX is non-trending, and a peak and reversal on the ADX may justify a bearish trade.
Tip: To mitigate the limitations of MACD, seek confirmation from other trend-following indicators, like the DMI system and the ADX.
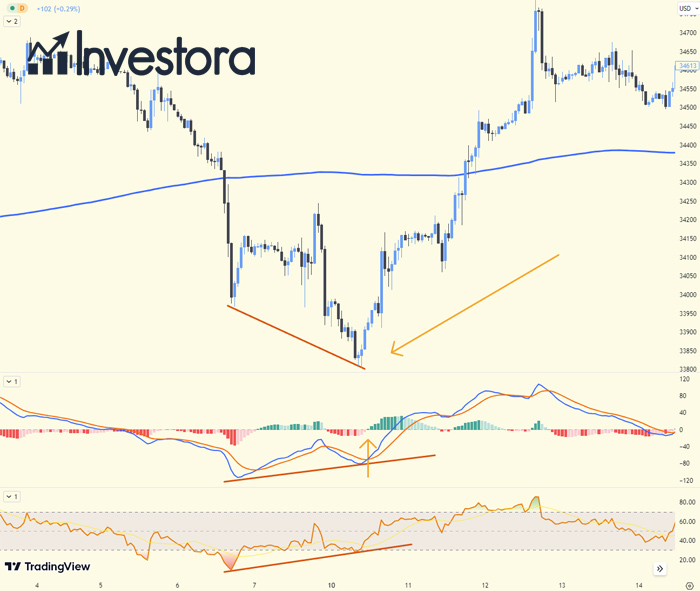
Divergence in MACD
When the MACD forms highs or lows that surpass the corresponding highs or lows on the price, it's known as a divergence. A bullish divergence arises when the MACD forms two rising lows that correspond with two falling lows on the price. Even in a negative long-term trend, bullish divergences can hint at a change in the trend, offering a valuable signal for traders.
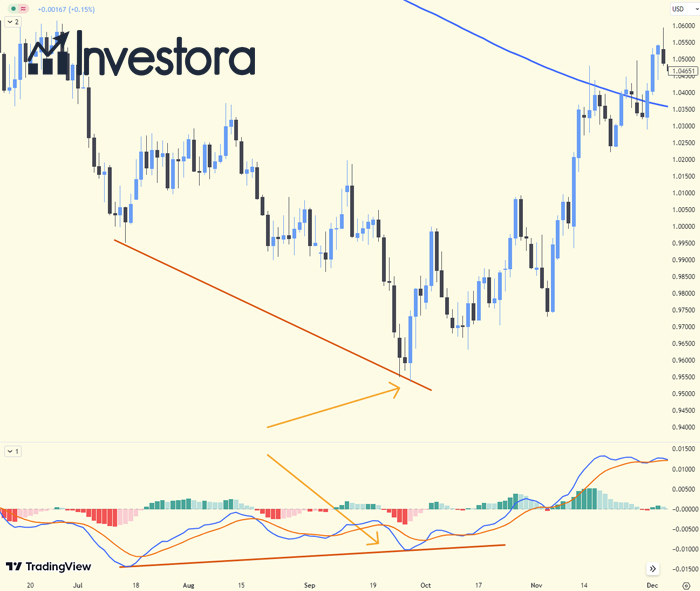
Interesting Fact: Divergences in MACD, despite being more complex to spot, can provide valuable signals for experienced traders.
MACD Frequently Asked Questions
How can MACD Indicator help me in trading?
The MACD Indicator can assist traders by identifying potential buy and sell signals, discerning whether a security is overbought or oversold, and detecting potential price reversals.
What should I look for in a MACD Indicator to enter trades?
When the MACD line crosses above the signal line, it is often a good time to buy, and when the MACD line crosses below the signal line, it might be a good time to sell or short.
How can the MACD indicator be used to predict price reversals?
The MACD can identify bullish and bearish divergences, such as when a new price high isn't confirmed by a new high in the MACD, suggesting potential price reversals. When the MACD line dips below the signal line, it's usually a signal to sell or short the security, while when the MACD line soars above the signal line, it's typically seen as a cue for traders to buy.
What is the optimal setting for the MACD in daily trading?
In daily trading periods, the optimal MACD settings are generally 26/12/9 days. This refers to the 26-period EMA, 12-period EMA, and the 9-period EMA of the MACD line, which forms the signal line.
How does MACD indicate overbought or oversold conditions?
The MACD doesn't have fixed overbought or oversold levels. Instead, it functions on a relative basis, indicating overbought or oversold conditions based on the strength of price movements and potential reversals.
What is the difference between MACD and RSI in trading?
The MACD is a trend-following momentum indicator, while the RSI signals overbought or oversold conditions relative to recent price levels. MACD lines do not have fixed overbought or oversold levels, requiring traders to compare the level and direction of the MACD/signal lines with previous price movements.
What are the limitations of the MACD indicator?
The MACD can sometimes produce false positives, suggesting a potential reversal that doesn't happen. It can also fail to predict some actual price reversals. To mitigate this, traders often seek confirmation from other trend-following indicators, such as the Directional Movement Index (DMI) and the Average Directional Index (ADX).
How does divergence in MACD work?
Divergence in MACD occurs when the MACD forms highs or lows that surpass the corresponding highs or lows on the price. For instance, a bullish divergence arises when the MACD forms two rising lows that correspond with two falling lows on the price. Such divergences can hint at a change in trend, providing a valuable signal for traders.
How to use MACD in combination with other indicators for efficient trading?
The MACD can be used in conjunction with other indicators for more efficient trading. For example, while the MACD might indicate a bearish divergence, the Average Directional Index (ADX) could reveal a higher trend, cautioning against a bearish trade based solely on the MACD signal. Using these indicators together can provide a more comprehensive view of market conditions.
Tip: Look for bullish divergences during a negative long-term trend for signs of a potential trend change.
The MACD indicator is a powerful tool for trend-following and momentum detection in financial trading. It is calculated using two EMAs of a security's price, yielding a MACD line and a signal line. While it offers valuable insights, traders should also consider its limitations and confirm signals with other indicators. Understanding the MACD, along with other indicators like the RSI and ADX, can enhance your trading strategy and increase your chances of success in the markets.
- Share this article

Matteo Rossi
Matteo Rossi is a seasoned financial expert, proficient in areas of investment strategies, bonds, ETFs, and fundamental analysis. With over a decade in the financial sector, Matteo has developed a keen eye for determining the intrinsic value of securities and deciphering market trends. He specializes in offering sharp insights on bonds and ETFs, with a firm belief in long-term investing principles. Through Investora, he aspires to educate readers about creating a diverse investment portfolio that stands the test of time. Outside the financial realm, Matteo is a passionate classical music enthusiast and a committed advocate for environmental conservation.