How to Use the Money Flow Index (MFI) for Effective Trading
Investora presents an insightful guide into the world of the Money Flow Index (MFI), a powerful tool in the technical analysis landscape. Offering traders unique perspectives through incorporating both price and volume data, the MFI acts as a vital instrument to identify market trends and potential reversals. With real-world examples and in-depth explanations, we unravel the intricacies of the MFI, its distinctions from other indicators, and the potential limitations traders need to be mindful of.
Money Flow Index (MFI): A Comprehensive Look
Delving into the world of technical analysis, one encounters a myriad of indicators, each with its unique methods of interpreting market movements. Among these, the Money Flow Index (MFI) stands out due to its holistic approach, combining price and volume data to generate powerful insights. This blend of information often leads some market observers to refer to the MFI as a volume-weighted Relative Strength Index (RSI).
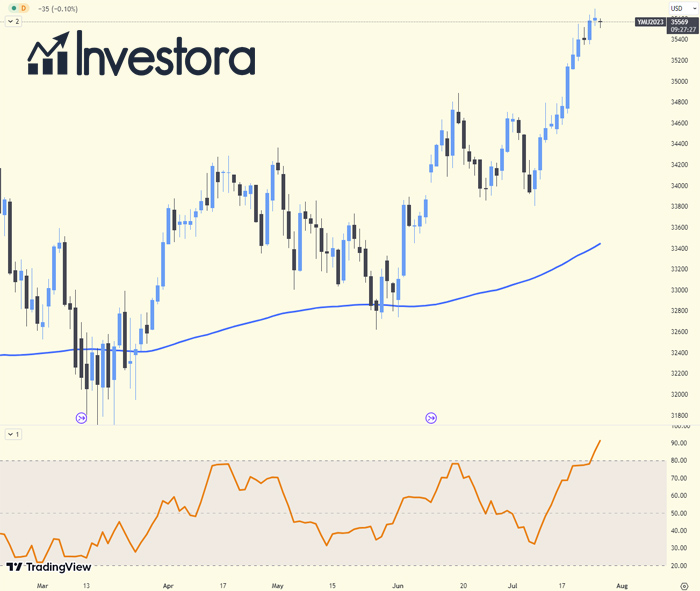
At its core, the MFI is an oscillatory indicator that fluctuates between 0 and 100. Traders use these numbers to discern potential market overselling or overbuying. When MFI values exceed 80, markets are considered overbought, while readings under 20 signify oversold conditions. More extreme thresholds of 10 and 90 also find application among some market participants.
A distinctive feature of the MFI is its ability to spot divergences – situations where price trends differ from the indicator's movement. These divergences often signal upcoming trend reversals, offering traders vital information to adjust their strategies accordingly.
Interesting Fact: The MFI is often referred to as a volume-weighted RSI because it incorporates both price and volume data, unlike the RSI, which only considers price data.

Understanding the Math Behind the Money Flow Index (MFI)
The Money Flow Index (MFI) might seem complex at first glance due to its mathematical basis. However, understanding the formula can provide deeper insights into the indicator's function and interpretation. So, let's demystify it.
The MFI calculation involves several steps and multiple variables. Here's the primary formula:
MFI = 100 - (100 / (1 + Money Flow Ratio))
The Money Flow Ratio here is calculated as:
Money Flow Ratio = 14 Period Positive Money Flow / 14 Period Negative Money Flow
Now, let's break down each of these elements.
Raw Money Flow, a crucial part of the process, is the Typical Price multiplied by the Volume of a given period:
Raw Money Flow = Typical Price / Volume
And, the Typical Price is calculated as the average of the High, Low, and Close prices:
Typical Price = (High + Low + Close) / 3
Positive and Negative Money Flows are then determined by comparing the Typical Price of the current period with the previous one. When the Typical Price increases, the Raw Money Flow is Positive and is added to Positive Money Flow. If the Typical Price decreases, the Raw Money Flow is Negative and is added to Negative Money Flow.
With a firm grasp of these calculations, you'll gain a deeper understanding of the MFI's mechanics, allowing you to make more informed trading decisions.
Fact: The process of calculating the MFI manually can be quite extensive, which is why most traders use automated charting software or spreadsheets to calculate it efficiently.
Interpreting MFI Signals: A Practical Approach
The MFI serves as a vital tool to recognize divergence, which is when the indicator moves in contrast to the price. For instance, consider a commodity whose price has been climbing consistently while the MFI begins to drop from a high reading, say 80. This divergence may imply an imminent downward price reversal. Similarly, a rising MFI from below 20, while the asset price continues to dip, might signal an upcoming price uptick.
Let's look at a hypothetical scenario to elucidate this further. Assume a company's stock, after a robust rally, hits a high of $150. Post this peak, it retraces to $130 before resuming its upward journey to reach $160. Here, we have two successive price highs at $150 and $160. If during this period, the MFI fails to reach a higher peak, it suggests a divergence from the price trend, hinting at a possible price decline in the future.
Remember: While rare, MFI values below 10 or above 90 can indicate significant trading opportunities, but these should be verified with additional market data or indicators.
Additionally, the MFI's overbought and oversold thresholds can serve as a tool to identify potential trade opportunities. MFI movements below 10 or above 90 are rare, but when they do happen, traders take note. A rise in MFI above 10 could be a signal to initiate a long trade, while a drop below 90 could suggest a potential short trade.
There are further applications of the MFI's overbought or oversold conditions. When an asset exhibits an uptrend, a drop in MFI below 20 (or 30), followed by a rally back above this threshold, could imply that a price correction has concluded and the uptrend may resume. The converse is true for a downtrend. A brief price rally pushing the MFI up to 70 or 80, followed by a drop below this level, could signal a potential entry point for a short trade, anticipating a further drop in price.
Tip: Pay special attention to divergences when analyzing MFI, as they often provide early warning signs of potential market trend reversals.
MFI versus RSI: A Comparative View
Both the MFI and RSI serve as valuable tools in a trader's arsenal, each offering unique insights. The fundamental distinction lies in the MFI's consideration of volume data, unlike the RSI, which relies solely on price data. This inclusion of volume information in the MFI often allows it to provide earlier warnings of potential reversals, making it a leading indicator in the eyes of volume analysis enthusiasts. It's crucial to note, however, that neither indicator is categorically superior to the other. They are different tools addressing different aspects of market data, and therefore, provide signals at different times.
Interesting Fact: Due to their differences, MFI and RSI can sometimes provide conflicting signals, highlighting the importance of a multi-faceted approach to technical analysis.
Recognizing the MFI's Limitations
While the MFI offers valuable insights, it's not immune to generating false signals. These are situations where the indicator suggests a potential trading opportunity that doesn't pan out, resulting in a loss. For instance, a divergence signaled by the MFI may not always culminate in a price reversal. Similarly, the MFI may occasionally fail to indicate vital market moves. Given these limitations, traders should use the MFI in conjunction with other analysis tools and risk control measures rather than relying on it exclusively.
Important: The MFI is not foolproof and may sometimes provide false signals, or fail to signal significant market moves.
Money Flow Index (MFI) Frequently Asked Questions
What does the MFI indicator tell us?
The MFI indicator provides insights into the buying and selling pressure on an asset by incorporating both price and volume data. It oscillates between 0 and 100, with values above 80 typically indicating overbought conditions and values below 20 suggesting oversold conditions.
Should I buy when the MFI Indicator is low?
A low MFI reading (below 20) may indicate oversold conditions, suggesting that the asset might be undervalued. This could present a buying opportunity. However, investors should use additional analysis techniques and consider other market factors before making a purchase decision.
Can the MFI help predict price reversals?
Yes, the MFI can often help predict price reversals through a phenomenon known as divergence. This happens when the price trend and MFI trend move in opposite directions. However, while divergence can be a strong signal, it's not always a guarantee of a price reversal.
How does the MFI differ from the RSI?
Both MFI and RSI are momentum oscillators, but the key difference lies in their data inputs. MFI incorporates both price and volume data, while RSI considers only price data. This volume consideration can make the MFI a more comprehensive and nuanced indicator.
What does it mean if the MFI is rising while prices are falling?
This is an example of bullish divergence and could indicate a potential trend reversal. If the MFI is rising while prices are falling, it suggests that buying pressure may be increasing despite the declining prices, possibly leading to a future uptrend.
Can I use the MFI indicator on its own to make trading decisions?
While the MFI is a useful tool, it's generally not recommended to use it as the sole basis for trading decisions. The MFI can occasionally give false signals, and it's beneficial to confirm its readings with other indicators or forms of analysis. Diversifying your analysis methods can help ensure more accurate predictions and more informed decisions.
Tip: Always use the MFI in conjunction with other analysis tools and risk management strategies to minimize potential losses from false signals.
The Money Flow Index (MFI), a unique oscillator in the technical analysis toolbox, provides a holistic view of market movements by considering both price and volume data. While powerful, the MFI's complex calculation and potential for false signals necessitate its use alongside other indicators for comprehensive market analysis. As with all trading tools, understanding the MFI's strengths and limitations is key to leveraging its insights effectively.
- Share this article


