Bollinger Bands®: Your Secret Weapon in Trading
Bollinger Bands®, a critical tool in the world of technical analysis, provides invaluable insights into the unpredictable terrain of the stock market. Developed by renowned technical trader John Bollinger, this tool identifies potential overbought and oversold conditions, helping investors traverse volatile market movements.
The comprehensive guide that follows delves into the nuances of Bollinger Bands®, dissecting its calculations, functionalities, and limitations. It also explores the strategies derived from this indicator, offering a holistic understanding for both novice and experienced traders.
Grasping Bollinger Bands®: A Crucial Market Indicator
Bollinger Bands® serve as a set of trendlines that define the possible overbought and oversold territories. These lines represent two standard deviations away from a security's Simple Moving Average (SMA) – one positively and the other negatively. The SMA typically calculates the average of a security's price over a period, which is often 20 days. These trendlines can be customized according to individual trading strategies and market conditions.
These bands encapsulate three key elements: the middle band (the simple moving average), and an upper and lower band. The upper and lower bands normally deviate by two standard deviations from the 20-day simple moving average. They represent the levels where the price is considered overbought or oversold.
Interesting Fact: The Bollinger Bands are named after their creator, John Bollinger.
Cracking the Code: Computing Bollinger Bands®
To employ Bollinger Bands®, the first step involves calculating the 20-day SMA of the security. This SMA is computed by averaging the closing prices of the first 20 days. Following this, the earliest price is excluded, the 21st-day price is incorporated, and the average is recalculated. This process is repeated for subsequent days.
Then, the standard deviation, which measures the degree of price volatility, is determined. In statistical terms, standard deviation depicts how dispersed values are from an average. It is calculated by taking the square root of the average of squared deviations from the mean.
The final step is to multiply the standard deviation by two, adding and subtracting it from each point along the SMA, creating the upper and lower bands, respectively.
The formula for Bollinger Bands® is:
BOLU = MA(TP,n) + m ∗σ[TP,n]
BOLD = MA(TP,n) - m ∗σ[TP,n]
Where:
- BOLU = Upper Bollinger Band
- BOLD = Lower Bollinger Band
- MA = Moving Average
- TP (typical price) = (High + Low + Close) / 3
- n = Number of days in smoothing period (typically 20)
- m = Number of standard deviations (typically 2)
- σ[TP,n] = Standard Deviation over last n periods of TP
Remember: Standard deviation in Bollinger Bands® context represents the degree of price volatility.
Deciphering the Signals: Understanding Bollinger Bands®
Bollinger Bands® provide traders with significant market trends and potential trading signals. As prices approach the upper band, the market is considered to be overbought, indicating a possible sell signal. Conversely, as prices near the lower band, the market is deemed oversold, suggesting a potential buying opportunity.
John Bollinger, the creator of this tool, has outlined a set of 22 rules that guide the effective use of these bands in trading. One of these pivotal concepts is the "squeeze." When the bands converge around the moving average, reducing its width, it indicates a squeeze, which in turn signals a period of low volatility. Traders often view this as an indicator of impending high volatility, presenting potential trading opportunities. Conversely, the widening of bands indicates high volatility and the potential to exit a trade.
Importantly, price breakouts, or movements beyond the bands, are also significant events. They occur approximately 90% of the time, but do not provide clear-cut trading signals. While they indicate a strong price movement, they do not specify the direction or extent of the future price movement.
Tip: Watch for the "squeeze" scenario in Bollinger Bands® as it signals impending high volatility.
Practical Applications: Bollinger Bands® in Action
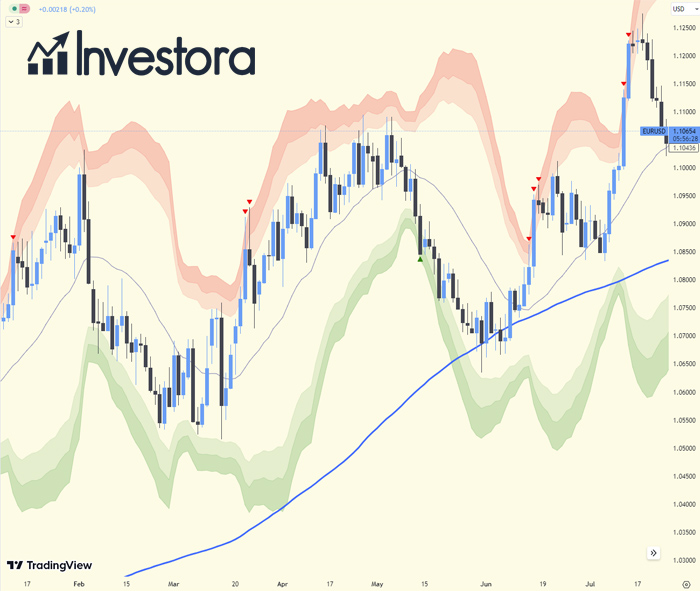
In real-world trading, Bollinger Bands® provide a dynamic view of price volatility. The bands widen during periods of high volatility and contract when the market is quiet. This adaptive nature makes Bollinger Bands® a versatile tool that adjusts to changing market conditions.
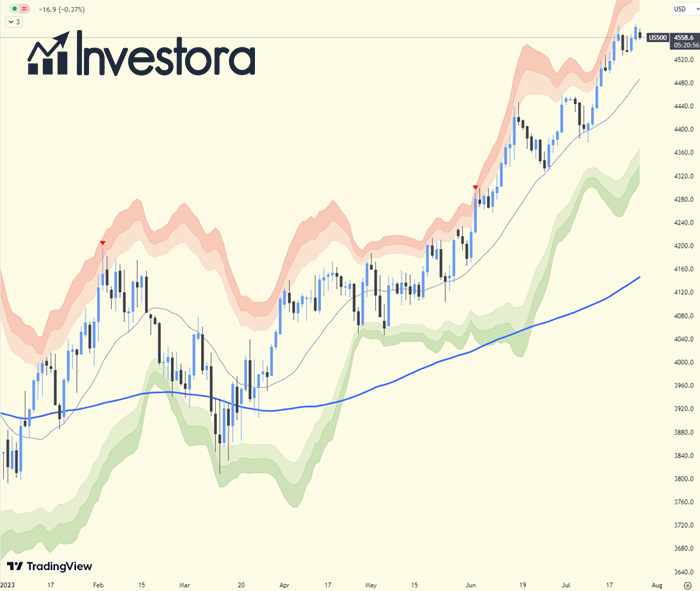
In an illustrative example, the upper and lower Bollinger Bands® encapsulate the 20-day SMA of a stock, dynamically adjusting to the daily price movements. The extent of the band's spread provides insights into the prevailing market volatility.
Tip: Use Bollinger Bands® to identify periods of high volatility (when bands widen) and low volatility (when bands contract).
Recognizing the Limits: Drawbacks of Bollinger Bands®
Despite being an effective tool for assessing price volatility, Bollinger Bands® should not be used in isolation. John Bollinger himself recommends using them in conjunction with two or three other non-correlated indicators. Some popular techniques include moving average divergence/convergence (MACD), on-balance volume, and relative strength index (RSI).
One significant limitation is that Bollinger Bands® rely on a simple moving average, which assigns equal weight to all data points. As a result, new information may be diluted by outdated data. Moreover, the standard use of 20-day SMA and 2 standard deviations may not work for everyone in every situation. Traders need to adjust these parameters and monitor them constantly.
Important: Bollinger Bands® should be used in conjunction with other non-correlated indicators.
Assessing the Accuracy of Bollinger Bands®
Given that Bollinger Bands® are plotted at +/- two standard deviations around the SMA, approximately 95% of the observed price action is expected to fall within these bands. This ensures a high degree of accuracy, making Bollinger Bands® a reliable tool for traders.
Determining the Optimal Time Frame for Bollinger Bands®
Typically, Bollinger Bands® employ a 20-day moving average, making this the most commonly used time frame. However, depending on individual trading strategies and the nature of the market, traders can customize this time frame.
Tip: Experiment with different time frames for the Bollinger Bands® to find the optimal setting that aligns with your trading strategy.
Bollinger Bands® Frequently Asked Questions
What are Bollinger Bands® and how do they function in trading?
Bollinger Bands® are a type of statistical chart characterizing the prices and volatility of a financial instrument over time. They consist of a simple moving average (SMA) line, with two standard deviation lines plotted above and below it. The spacing between these lines varies based on the volatility of the prices. In trading, Bollinger Bands® provide potential entry and exit points. When the price nears the upper band, it may be considered overbought (a sell signal), and when it approaches the lower band, it could be deemed oversold (a buy signal).
How do you interpret Bollinger Bands® for successful trading?
Bollinger Bands® provide key market trends and trading signals. Prices nearing the upper band suggest an overbought market, implying a potential sell signal, while prices near the lower band suggest an oversold market, indicating a possible buying opportunity. Furthermore, a concept called the "squeeze," when the bands converge around the moving average, indicates a period of low volatility, which traders often view as a precursor to a period of high volatility, thus providing potential trading opportunities.
Are Bollinger Bands® a reliable tool for predicting future market trends?
Bollinger Bands® can provide traders with useful insights into market trends and volatility. However, like any trading tool, they should not be used in isolation. They are most effective when used in conjunction with other non-correlated indicators and market analysis. Remember, Bollinger Bands® do not predict the direction of future price movements; they only provide information on volatility and potential overbought or oversold conditions.
How do Bollinger Bands® adjust to changing market conditions?
The unique aspect of Bollinger Bands® is their adaptive nature. The bands widen during periods of high volatility and contract when the market is quiet. This means that Bollinger Bands® adjust in real-time to reflect the current market situation, providing a dynamic view of price volatility.
What are the limitations of Bollinger Bands® in trading?
Despite their effectiveness, Bollinger Bands® have limitations. They rely on a simple moving average, which gives equal weight to all data points, potentially diluting new information with outdated data. Also, the standard parameters (20-day SMA and 2 standard deviations) may not suit every trader or every situation. Traders should adjust these parameters based on their individual trading strategies and constantly monitor them.
Can Bollinger Bands® be customized according to individual trading strategies?
Yes, Bollinger Bands® can be customized to fit individual trading strategies. While the most common configuration uses a 20-day SMA and two standard deviations, traders can adjust these parameters depending on their trading strategies and market conditions. However, traders should be aware that any changes should be tested before applying to real-world trading to ensure their effectiveness.
How can Bollinger Bands® assist me in trading?
Bollinger Bands® can provide insights into potential overbought and oversold conditions, helping you make informed trading decisions. They can also indicate periods of low and high market volatility, allowing you to adjust your trading strategies accordingly.
Remember: As with any trading tool, understanding its limitations and adapting Bollinger Bands® to your trading style is key to success.
Final Word
Bollinger Bands® serve as a powerful tool for investors to identify potential entry and exit points in the market. While they are not a foolproof strategy, they provide a robust framework for understanding market volatility and potential trading opportunities. Their unique feature of the "squeeze" is particularly beneficial for currency trading. By purchasing when stock prices drop below the lower Bollinger Band®, traders can often capitalize on oversold conditions and profit when the stock price reverts to the central moving-average line.
Despite their utility, it's essential to remember that Bollinger Bands® should be used in conjunction with other indicators for the best results. As with any trading tool, understanding its limitations and adapting it to your trading style is critical to success.
In the world of trading, knowledge is power. And understanding the intricacies of tools like Bollinger Bands® can provide the insights needed to navigate the turbulent waters of the stock market. Armed with these insights, you can make more informed decisions and bolster your trading strategies.
- Share this article

Victoria Ivanova
Victoria Ivanova, an accomplished financial expert specializing in ETFs, stock trading, and fundamental analysis, has been a guiding light for Investora's readers over the years. With a decade of experience navigating complex financial markets, Victoria’s insights are both practical and insightful, offering readers a unique perspective. Outside the finance world, Victoria enjoys astronomy, often drawing parallels between the vastness of space and the financial market’s opportunities.