Mastering the Relative Strength Index (RSI): A Comprehensive Guide
Unlocking the power of technical analysis with the help of Relative Strength Index (RSI), a leading indicator in charting methods, could be your key to successful trading. In the world of trading, knowledge is power. This article, crafted by Investora, delves deep into the inner workings of the RSI, its calculations, applications, and critical nuances. Brace yourself for an insightful journey into the realm of RSI, where we'll decode its significance in trend identification, buy-sell signals, trend reversals, and its limitations.
The Magic Wand of Trading - Understanding Relative Strength Index (RSI)
The Relative Strength Index, better known as the RSI, is a powerful tool that lends a hand in technical analysis of securities. This momentum oscillator, with its roots dating back to 1978 by the ingenious J. Welles Wilder Jr., assists in measuring the magnitude and velocity of price changes. The objective? To determine if a security is overbought or oversold.
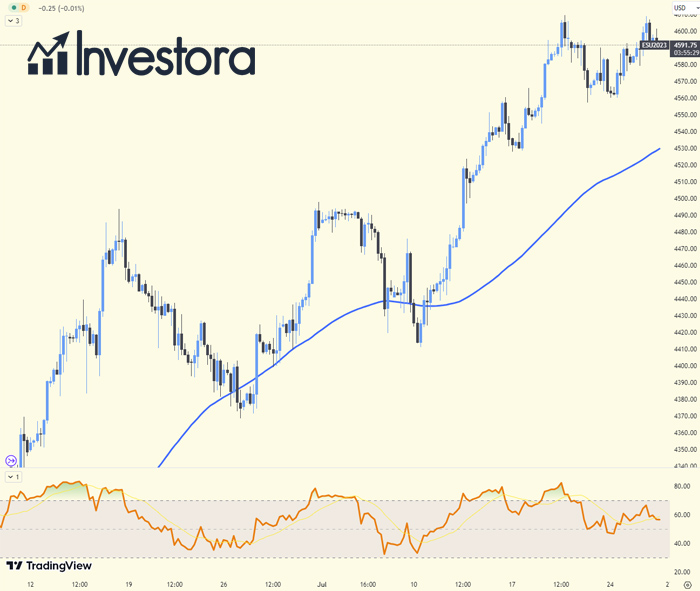
RSI's graphical representation is an oscillator ranging from zero to 100. Beyond merely identifying overbought and oversold conditions, the RSI paves the way to predict trend reversals and potential price corrections. When it comes to trading signals, an RSI value of 70 and above is seen as overbought, while a value of 30 or below signals an oversold state.
Interesting Fact: The RSI was developed by J. Welles Wilder Jr. in 1978.
Decoding the Intricacies of the RSI
One might wonder how the RSI operates in determining a security's relative strength. To put it simply, it juxtaposes the strength of a security on days of price increase with the strength on days of price decrease. This correlation to price action provides a deeper understanding of a security's potential behavior.
However, it's essential to understand that the RSI isn't a standalone hero. When used in harmony with other technical indicators, it can significantly enhance the decision-making process in trading.
Tip: Always use the RSI in conjunction with other indicators for more reliable signals.

How is RSI Calculated?
At its core, the RSI involves a two-step calculation. The initial formula is:
RSI Step One = 100 - [ 100 / 1 + (Average gain / Average loss) ]
Here, the average gain or loss refers to the average percentage increase or decrease during a look-back period. Interestingly, in the calculation, any period with a price decrease is counted as zero for average gain, and similarly, any period with a price increase is counted as zero for average loss.
By convention, the RSI utilizes 14 periods for its initial calculation. Consider an example where the market closes higher on seven of the past 14 days, boasting an average gain of 1%, while the other seven days close lower with an average loss of -0.8%. Once you have 14 periods of data, you can move onto the second step:
RSI Step Two = 100 - [ 100 / 1 + ( (Previous Average Gain x 13) + Current Gain / (Previous Average Loss x 13) + Current Loss) ]
The goal of this second step is to smooth the results, ensuring the RSI only nears 100 or zero during strongly trending markets.
Important: Understanding the RSI calculation process can help you better interpret its readings.
The Value of RSI in Trading
So why should traders bother with the RSI? It provides actionable insights, validating trends, spotting potential trend reversals, and identifying overbought and oversold securities. For short-term traders, it offers valuable buy and sell signals, working in concert with other indicators to support robust trading strategies.
Fact: The RSI is a preferred tool among many traders due to its effectiveness in signaling potential buying or selling opportunities.
The Art of Using RSI With Market Trends
A thorough understanding of the security's primary trend is essential to interpret the RSI accurately. Noted market technician Constance Brown proposed that in an uptrend, an oversold RSI reading may actually be much higher than 30, and conversely, an overbought reading during a downtrend may be much lower than 70.
For instance, during a downtrend, the RSI often peaks near 50 rather than 70, offering a more reliable indicator of bearish conditions. Many traders draw a horizontal trendline between the 30 and 70 levels when a strong trend is apparent, to better identify the overall trend and its extremes.
However, adjusting the RSI levels is unnecessary when the price of a stock or asset is in a long-term horizontal channel or trading range. This is because the RSI is less reliable in trending markets compared to trading ranges. Hence, traders often view signals given by the RSI during strong upward or downward trends as false.
Tip: During strong trends, consider adjusting your overbought and oversold thresholds.
The Significance of the RSI in Trading
Why does the RSI matter? As a momentum indicator, it evaluates a security's performance on days when prices surge compared to days when they decline. This relative strength or weakness provides traders with valuable insights, particularly when used alongside other technical indicators, bolstering their decision-making capabilities.
The RSI serves multiple purposes:
- Predicting the price behavior of a security
- Verifying trends and potential reversals
- Identifying overbought and oversold market conditions
- Offering buy and sell signals for short-term traders
- Complementing other indicators to strengthen trading strategies
From its inception, the RSI has become an essential component of every trader's toolkit. However, understanding its calculation is vital to using it effectively.
Interesting Fact: RSI readings of 70 and above have been historically associated with market tops, while readings of 30 and below coincide with market bottoms.
The Power of RSI Divergence
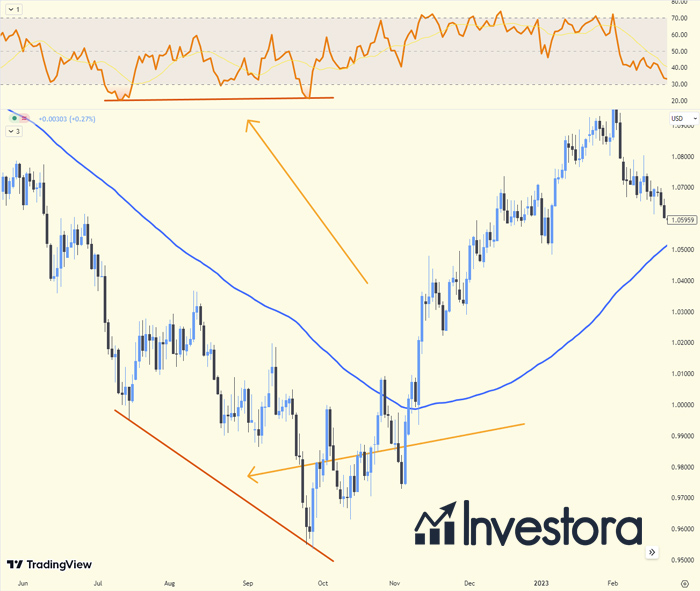
An RSI divergence occurs when the price and RSI indicator move in opposite directions. In other words, when the price is making higher highs and the RSI is making lower highs, it signals a bearish divergence. Similarly, when the price is making lower lows and the RSI is making higher lows, it signifies a bullish divergence.

These divergences often provide early warning signs of potential price reversals, giving traders a heads-up before the trend changes. Recognizing these signs can prove pivotal in predicting price movements and in identifying profitable trading opportunities.
Important: Divergence between price and RSI can be a powerful indicator of an impending reversal.
RSI Reversals
Traders often watch out for RSI reversals. A positive RSI reversal transpires when the RSI forms a lower low than its previous low, but the security's price forms a higher low than its previous low. This divergence signals a potential upward movement or bullish trend in the price.
On the other hand, a negative RSI reversal occurs when the RSI forms a higher high than its previous high, but the security's price forms a lower high than its previous high. This divergence suggests a potential downward movement or bearish trend in the price.
Remember: Positive RSI reversal often indicates a potential upward price trend, while a negative RSI reversal suggests a potential downward trend.
RSI Swing Rejections: An Advanced Technique
A less known, yet potentially effective technique involves observing the RSI as it crosses the 30 and 70 levels – commonly referred to as swing rejections. This concept is divided into four parts:
- The RSI falls into the oversold region (below 30).
- The RSI crosses back above 30.
- The RSI forms another dip but stays above 30.
- The RSI breaks its most recent high.
This pattern, known as a bullish swing rejection, can help predict an uptrend in price, presenting a potential buying opportunity. Similarly, a bearish swing rejection can hint at a possible downtrend, signaling a potential selling opportunity.
Tip: Understanding the concept of swing rejections requires practice, consider using a simulated trading environment to master it.
Recognizing the Limitations of RSI
Despite its manifold benefits, the RSI has its limitations. It can remain in the overbought or oversold region for prolonged periods, especially during a strong upward or downward trend, leading to false signals. As a result, it is most beneficial in range-bound markets where prices oscillate between bullish and bearish trends.
Moreover, true reversal signals are rare and can be hard to differentiate from false positives and negatives. Hence, while RSI is a potent tool, it should be used in conjunction with other technical indicators and market trend analysis.
Important: RSI can often give false signals during a strong trend, as it can remain overbought or oversold for extended periods.
Relative Strength Index (RSI) Frequently Asked Questions
What does a high RSI indicator mean for traders?
A high RSI (generally considered to be over 70) typically suggests that a security is overbought or overvalued, which could indicate a potential price correction or trend reversal. However, the context is important, and a high RSI doesn't automatically mean it's time to sell. Traders often use other indicators and data points to confirm signals.
When should I buy based on the RSI indicator?
Traders often consider it a good idea to buy when the RSI indicator shows a value below 30, suggesting that the asset is oversold or undervalued and might be due for a price correction or trend reversal. However, it's crucial to consider other indicators and factors to corroborate the RSI reading.
What does RSI divergence signal in trading?
An RSI divergence occurs when the price of a security and the RSI indicator move in opposite directions. A bullish divergence (price making lower lows, RSI making higher lows) often signals an upcoming upward price move, whereas a bearish divergence (price making higher highs, RSI making lower highs) can signal a potential downward price move.
How can RSI swing rejections be used in trading?
RSI swing rejections are an advanced technique where traders observe the RSI as it crosses the 30 and 70 levels. A pattern of this crossing can provide clues to future price movement. For example, a bullish swing rejection can predict an uptrend in price, while a bearish swing rejection can indicate a potential downtrend.
What are RSI reversals and how do they signal trading opportunities?
RSI reversals occur when the RSI forms a different pattern compared to the price of the security. A positive RSI reversal signals a potential upward price movement, while a negative RSI reversal suggests a potential downward price movement. These can provide early signals of a change in price direction.
Can the RSI indicator be used alone for trading decisions?
While the RSI indicator is a powerful tool, it is generally not recommended to use it alone for trading decisions. It's best used in conjunction with other technical indicators and within the larger context of market trends. This is because the RSI can give false signals, especially in strong trending markets where it can remain overbought or oversold for extended periods.
The Relative Strength Index (RSI) is a versatile tool in technical analysis that can provide invaluable insights into market behavior. By measuring the strength and speed of a security's price movement, it can help traders identify overbought and oversold conditions, spot potential trend reversals, and generate buy and sell signals. However, like any indicator, it has its limitations and works best when used in conjunction with other technical indicators and a clear understanding of market trends.
- Share this article


