A Guide to Technical Analysis: Trading with Precision and Confidence
Technical analysis is an influential trading strategy used by many traders across the world. This article delves into the nuances of technical analysis, exploring its significance, the different tools used, and how to implement this strategy effectively. We'll also dive into its historical evolution and the value it holds for modern traders, whether novice or experienced. Understanding the concepts of technical analysis can help navigate the often tumultuous journey of stock market trading. Join us as we explore this fascinating world and address some of the most common questions related to technical analysis.
The Essence of Technical Analysis
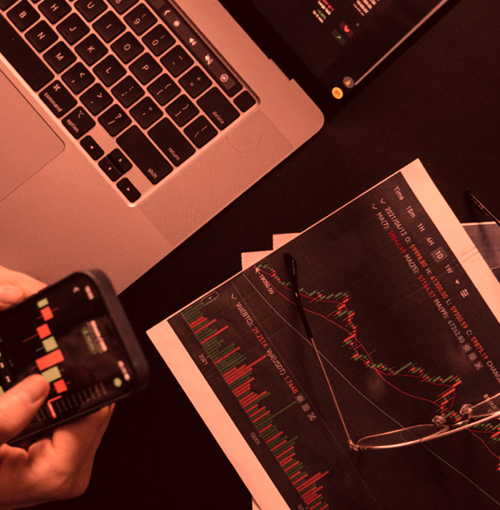
Technical analysis revolves around the examination of past market data, primarily focusing on price and volume. By using elements of market psychology, behavioral economics, and quantitative analysis, technical analysts make educated predictions about future market behaviors based on this past data. Two primary components form the backbone of technical analysis: chart patterns and technical indicators, both of which serve as statistical guides to market trends.
Analysts who favor technical analysis operate under the presumption that all relevant market information is already reflected in price charts. As such, technical analysis becomes an insightful tool for traders, equipping them with predictive abilities for future price movements and allowing them to identify profitable entry and exit points for their trades.
Fact: Technical analysis is a globally recognized trading strategy used by many traders across various markets.
Interesting Fact: Technical analysis is a powerful tool for making educated predictions about future market behaviors.
Interpreting Market Trends Through Technical Analysis
Technical analysis, in essence, is a toolbox of methods for interpreting price action within stocks. The primary focus of most technical analysts is to identify current market trends and predict their continuation or reversal. For this purpose, they employ a range of tools, such as trendlines, candlestick formations, and various mathematical visualizations. The use of these tools varies among analysts, with some favoring one over the other, while others prefer a combination to pinpoint potential entry and exit points for trades.
A typical technical analysis scenario might involve identifying a particular chart formation that suggests a suitable entry point for a short seller. However, the analyst doesn't stop there – they would further examine moving averages across different time frames to confirm the likelihood of a market breakdown.
Important: The foundation of technical analysis lies in the examination of past market data, primarily focusing on price and volume.
A Historical Perspective on Technical Analysis
The roots of technical analysis trace back hundreds of years. Notable figures in Europe, such as Joseph de la Vega, utilized early forms of this technique to predict Dutch markets in the 17th century. Over time, pioneers such as Charles Dow, William P. Hamilton, Robert Rhea, Edson Gould, and even a ballroom dancer named Nicolas Darvas, contributed to shaping the modern form of technical analysis.
These individuals introduced a fresh perspective on market trends, viewing them as measurable highs and lows on a chart rather than focusing on the specifics of the underlying companies. This eclectic blend of theories was formally assembled in 1948 with the publication of "Technical Analysis of Stock Trends" by Robert D. Edwards and John Magee.
Among the numerous tools in a technical analyst's arsenal, candlestick patterns hold a special place. This method, dating back to Japanese merchants studying trading patterns for their rice harvests, became popular in the U.S in the 1990s with the rise of internet day trading. Among the most crucial patterns are candlestick reversal patterns, such as the doji and the engulfing pattern, used to predict impending bearish reversals.
Tip: Understanding the historical evolution of technical analysis can provide insight into its methodology and the thought processes behind different strategies.
Remember: Candlestick patterns, originally used by Japanese merchants to track rice prices, are a crucial part of the modern technical analyst's toolkit.
Implementing Technical Analysis in Trading
The primary belief at the heart of technical analysis is that market prices already factor in all pertinent information that could influence a market. Therefore, technical analysts argue that there's no need to examine economic, fundamental, or new developments separately, as they're already priced into the security. This belief ties into another key assumption: prices move in trends and history tends to repeat itself, reflecting the overall psychology of the market.
Chart patterns and technical indicators are the two principal components of technical analysis. Chart patterns are subjective and involve technicians identifying areas of support and resistance on a chart by observing specific patterns. These patterns, rooted in psychological factors, aim to predict where prices are headed, following a breakout or breakdown from a specific price point and time.
On the other hand, technical indicators are a statistical form of technical analysis where technicians apply mathematical formulas to prices and volumes. The most common indicators include moving averages, which simplify price data to make it easier to spot trends. More complex indicators, such as the moving average convergence divergence (MACD), look at the interaction between several moving averages. A substantial number of trading systems are based on these technical indicators due to their quantitative nature.
Fact: The core belief of technical analysis is that market prices already incorporate all pertinent information that could influence a market.
Tip: Try to understand and recognize common chart patterns and technical indicators, as they are the key components of technical analysis.
Drawing a Line Between Technical Analysis and Fundamental Analysis
The world of finance is mainly divided into two camps - technical analysis and fundamental analysis. While technical analysts focus on following market trends as they appear, fundamental analysts have a different viewpoint. They believe that the market often fails to recognize inherent value and instead focus on scrutinizing the company's balance sheet and market profile to find intrinsic value not currently mirrored in the price.
There are countless examples of successful investors who use either fundamental or technical analysis to guide their trading strategies. Some even incorporate elements from both fields. However, in general, technical analysis caters to a swifter investing pace due to its reliance on chart trends, while fundamental analysis typically involves a longer decision timeline and holding period due to the extensive due diligence it requires.
Remember: While technical analysis is faster and more chart-focused, fundamental analysis requires more extensive due diligence and a longer decision timeline.
Tip: If you're investing for the long term, consider combining both technical and fundamental analysis to gain a more comprehensive view of the market.
Understanding the Limitations of Technical Analysis
While technical analysis offers powerful tools for traders, it's important to acknowledge its limitations. Misinterpretation of charts, trading based on low volume, or choosing inappropriate time periods for moving averages could lead to less-than-optimal trade decisions. Furthermore, there is a unique limitation inherent to technical analysis related to the impact of widely adopted strategies.
As more traders adopt technical analysis strategies and tools, these practices can influence price action. For instance, the formation of a bearish pattern like "three black crows" could occur because the priced-in information justifies a bearish reversal, or simply because traders universally agree that such a pattern should herald a bearish reversal and influence the market by taking up short positions. This poses an intriguing question for analysts, although a true technical analyst might be less concerned about the reason and more focused on whether their trading model continues to be effective.
Important: Despite its advantages, technical analysis does have limitations, such as the risk of misinterpreting charts, trading on low volume, or selecting inappropriate time periods for moving averages.
Frequently Asked Questions
What is technical analysis and how does it work?
Technical analysis is a method used in trading to predict future market trends based on historical price data and trading volumes. It employs various tools such as chart patterns and technical indicators to analyze and interpret market behavior.
How can I start learning technical analysis?
You can start learning technical analysis by reading books on the subject, attending workshops, taking online courses, or even getting a mentor who is an expert in the field. Begin by understanding basic concepts such as price patterns and trendlines before delving into more complex topics.
Is technical analysis a reliable method for trading?
Technical analysis, when used properly, can be a reliable method for trading. However, like any other trading strategy, it's not foolproof and does have limitations. It's important to use technical analysis in conjunction with other tools and information to make well-rounded trading decisions.
What are some common tools used in technical analysis?
Some common tools used in technical analysis include trendlines, moving averages, relative strength index (RSI), and candlestick charts. These tools help traders identify potential trends, reversals, and breakout points in the market.
Does technical analysis work for all types of securities?
Yes, technical analysis can be applied to any market where historical price and volume data is available. This includes stocks, futures, commodities, fixed-income, currencies, and even cryptocurrencies.
Tip: To enhance your trading decisions, hone your skills in interpreting chart patterns and utilizing technical indicators.
Technical analysis is a powerful tool for predicting market trends and making informed trading decisions. It revolves around examining historical market data to predict future market behavior and relies on elements of market psychology, behavioral economics, and quantitative analysis. Despite its limitations, technical analysis is widely adopted by traders and continues to be a significant part of the investment world. The ability to interpret chart patterns and utilize technical indicators can be a game-changer for both novice and seasoned traders.
- Share this article

Adrian Müller
Adrian Müller is a seasoned financial analyst and a passionate writer. He has spent over a decade navigating the labyrinth of finance, honing his expertise in investing, economies, and market analysis. Adrian is known for his insightful commentary on investment strategies and for his keen eye in identifying potential market shifts. His specialties include stocks, ETFs, fundamental and technical analysis, and the global economy. Outside the world of finance, Adrian enjoys long-distance running and exploring world cuisines. At Investora, Adrian provides in-depth articles that serve to guide new and experienced investors alike towards informed and successful investment decisions.