
Support and Resistance: The Backbone of Technical Analysis
In the world of financial trading, technical analysis plays an integral role in understanding the future direction of market trends. Two fundamental concepts at the heart of this approach are 'support' and 'resistance'. By comprehending these principles, traders can predict potential turning points in the market's price trajectory, leading to more informed investment decisions. This comprehensive guide will shed light on the essence of support and resistance, how these can be identified, and the significance they hold in technical analysis. So, whether you're a seasoned trader or just beginning your journey in the financial markets, this piece promises to deliver insightful knowledge and practical tips to enhance your trading skills.
Decoding Support and Resistance in Technical Analysis:
In technical analysis, 'support' and 'resistance' serve as pivotal concepts. They represent specific price points on a chart that have the potential to decelerate, halt, or even reverse the prevailing trend of an asset's price. Understanding their function and how to spot them on a chart can be a game-changer for any trader.
The theory of support and resistance was first conceived from the Dow Theory and the law of supply and demand. Support and resistance are the basic building blocks of technical analysis.
Important: Support and resistance represent specific price points on a chart that can decelerate, halt, or reverse the prevailing price trend.
Tip: Traders should always look for support and resistance levels when analyzing charts to predict potential turning points.
Unraveling the Concept of Support:
Picture a downward trending market where supply exceeds demand, causing prices to dip. However, as prices continue to decrease, potential buyers sitting on the sidelines may find these lower prices increasingly attractive. As a result, demand begins to increase until it eventually balances out with supply, halting the price drop. This phenomenon is referred to as support in technical analysis.
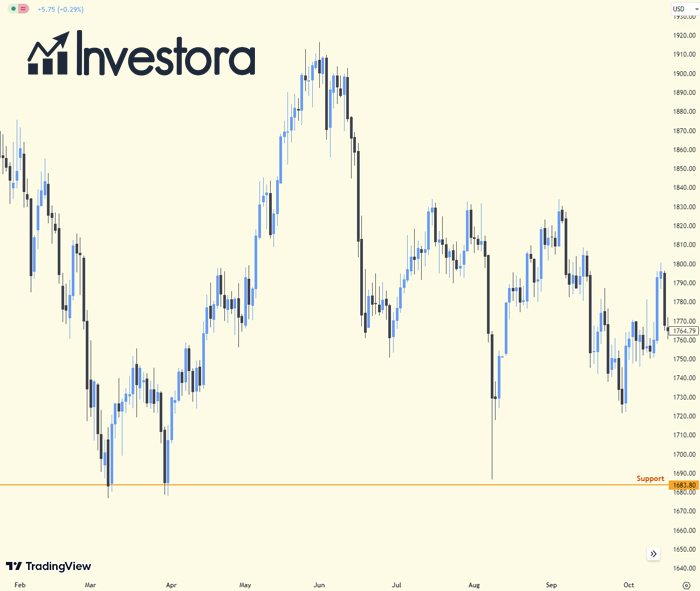
This support can manifest as a specific price point or a range within which the price tends to stabilize. It indicates an area where the demand to buy is strong enough to counterbalance the supply, causing the price to pause or even reverse.
Interesting Fact: Support levels can sometimes become resistance levels once they've been breached, and vice versa.
Understanding the Concept of Resistance:
Resistance serves as the antithesis to support. In an uptrend, where demand outweighs supply, prices are propelled upwards. However, as prices continue to ascend, they reach a stage where selling activity begins to outmatch buying interest. This situation can arise due to traders hitting their price targets, perceived overvaluation, or for myriad other reasons. This point, where supply starts to outweigh demand, is known as 'resistance'. Similar to support, resistance can also be a specific price level or a range.
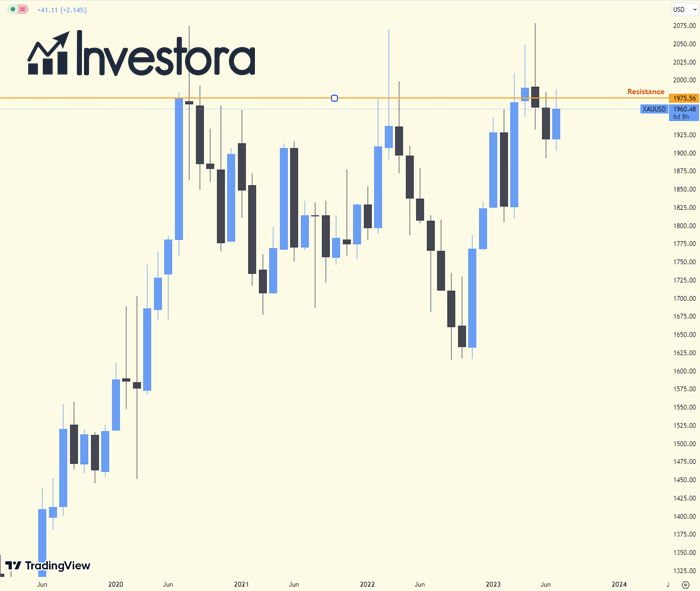
Just like support, resistance can become support once it has been breached and vice versa. Resistance levels indicate areas of increased selling interest that could halt an uptrend.
Tip: During an uptrend, monitor for potential resistance levels where the price might encounter selling pressure.
Support and Resistance: Not a One-Time Phenomenon:
Interestingly, once a price level has been identified as a zone of support or resistance, it continues to serve as a potential entry or exit point for future trades. Traders strategize based on the anticipation that these zones will either halt price movement (bounce) or be violated (break), causing the price to continue in its preceding direction. By 'betting' on the future direction of the price, traders can rapidly determine the efficacy of their strategy.
Past support and resistance levels can influence future price movements. In some cases, price levels can oscillate between support and resistance levels, creating a trading range.
Tip: Use past support and resistance levels as part of your trading strategy to identify potential future price turning points.
Taking it a Step Further:
While these concepts are fundamental, support and resistance are not confined to daily, weekly, or monthly charting periods. They can be found across all timeframes, from one-minute charts to five-minute ones, and even longer. The longer the time frame, the more significant the support or resistance becomes. Spotting these levels involves observing the chart for notable pauses in price movement, followed by monitoring whether the price halts or reverses as it approaches these points.
Technically, prices don't always strictly adhere to support or resistance levels. They may momentarily dip below support or reverse before reaching the resistance. Flexibility and a keen understanding of market dynamics are crucial when interpreting these patterns. As such, these levels are often viewed as 'zones' rather than fixed points. It's essential to note that these price levels aren't arbitrary – they emerge as a result of market participants acting on similar information and placing trades at akin levels.
Remember: Support and resistance levels can be found across all timeframes.
More Than Lines: The Role of Trend Lines, Channels, and Moving Averages
While support and resistance are often depicted as horizontal lines, it's important to note that they can take other forms. Trend lines and channels are among those commonly used in technical analysis.
Trend lines are diagonal lines drawn by connecting two or more lows or highs. The upward sloping line connecting at least two lows forms an ascending trend line, providing support. Conversely, a descending trend line connecting at least two highs serves as resistance.
Channels are created when parallel trend lines can be drawn. In an upward trend, a line is drawn to connect the swing lows (providing support), and a parallel line is drawn to touch the swing highs (acting as resistance). The area between these lines forms the 'channel'. The same concept applies to downward trending markets.
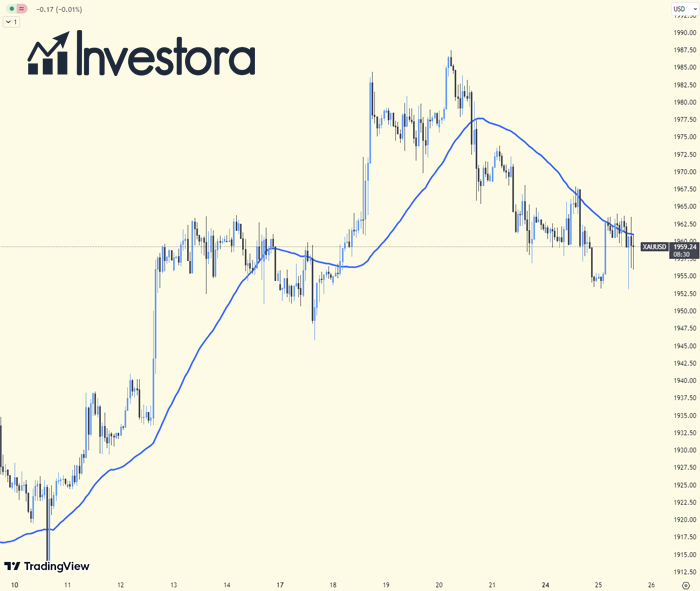
Moving averages can also act as dynamic support and resistance levels. These are lines that average out past prices to smooth out price action and help identify the trend. They are 'dynamic' because they move with the price, adjusting to the market's current conditions.
Remember: Trend lines, channels, and moving averages can also act as dynamic support and resistance levels in technical analysis.
Breakouts and Re-tests
Breakouts occur when the price breaches a previously established support or resistance level. These breakouts can be powerful signals for traders, indicating that the dynamics of supply and demand have shifted. But not all breakouts guarantee a successful trade. Some breakouts are 'false' with the price reversing shortly after the breakout, a scenario known as a 'whipsaw'. It's crucial to seek additional confirmation after a breakout, such as increased volume or a re-test of the broken level.
When a price breaks a level and then comes back to it, it's called a re-test. For instance, if the price breaks above resistance, it may pull back to the same level before resuming the uptrend. This former resistance level can become new support. Re-tests can offer compelling trading opportunities, as they provide confirmation of the breakout and a clear area to place stop-loss orders.
Important: Breakouts occur when the price breaches a previously established support or resistance level and can be powerful signals for traders.
Psychology Behind Support and Resistance
The psychology of market participants plays a crucial role in the establishment of support and resistance levels. These levels often reflect points where traders have made decisions in the past, leading to significant buying or selling activity that can stall the price movement.
For example, a resistance level might form because many traders have open sell orders at that price, anticipating that the asset is overvalued. Similarly, a support level might form because many traders see the price as a bargain, placing buy orders at that level. Round numbers also often form psychological support and resistance levels because traders tend to place orders at these easily remembered levels.
Tip: Consider market psychology and trader's behavior when determining potential support and resistance levels.
Support and Resistance FAQ: Frequently Asked Questions
Do support and resistance work in technical analysis?
Yes, support and resistance are fundamental concepts in technical analysis. They represent levels on a price chart where price trends could potentially pause or reverse due to market dynamics.
How do you draw support and resistance lines?
Support and resistance lines are drawn by connecting the low points and high points on a price chart, respectively. The lines illustrate levels where the price has historically had difficulty moving beyond, thereby acting as potential barriers in the future.
Can support become resistance and vice versa?
Yes, it is common for support levels to turn into resistance levels and vice versa. For example, when a price breaks below a significant support level, that level can turn into resistance for future price advances.
Why are round numbers important in support and resistance?
Round numbers are often psychologically appealing to traders and are commonly used for setting buy and sell orders. As a result, these levels often act as significant support and resistance zones.
How reliable are support and resistance levels?
While support and resistance levels are widely used by traders and can have predictive power, they are not infallible. Prices can and do break through support and resistance levels, hence, risk management is crucial in any trading strategy.
What happens when a support level is broken?
If a support level is broken, it's typically a bearish signal suggesting the price may continue to fall. Often, a broken support level can become a new resistance level.
Remember: Understanding support and resistance can provide valuable insights into the market's behavior and help traders make informed decisions.
Support and resistance levels are fundamental tools in the technical analyst's toolbox. Understanding these concepts can provide valuable insights into the market's behavior and help traders make informed decisions. However, like all tools, they're not foolproof and should be used in conjunction with other technical analysis tools and risk management strategies. The best trading strategies often incorporate a combination of different tools and techniques to maximize their effectiveness.
- Share this article

Adrian Müller
Adrian Müller is a seasoned financial analyst and a passionate writer. He has spent over a decade navigating the labyrinth of finance, honing his expertise in investing, economies, and market analysis. Adrian is known for his insightful commentary on investment strategies and for his keen eye in identifying potential market shifts. His specialties include stocks, ETFs, fundamental and technical analysis, and the global economy. Outside the world of finance, Adrian enjoys long-distance running and exploring world cuisines. At Investora, Adrian provides in-depth articles that serve to guide new and experienced investors alike towards informed and successful investment decisions.