
Pullbacks Vs. Reversals: Navigating Market Dips
Investora brings you a comprehensive guide on one of the vital concepts in trading -pullbacks. Trading can often feel like trying to navigate a maze due to the numerous terms and concepts involved. However, understanding these ideas, such as pullbacks, can make a world of difference in your trading strategy and overall profit margins. This detailed and in-depth piece will provide you with a thorough understanding of pullbacks, how they function within trading, and how best to utilize them to optimize your trading strategy.
The Fundamentals of Trading Pullbacks
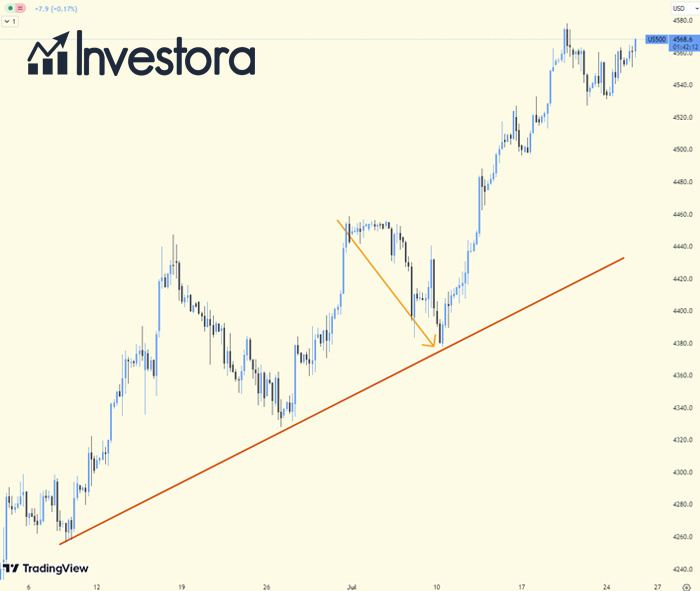
In the world of trading, 'pullback' is a term used to denote a temporary, moderate dip in an asset or stock's price that has recently experienced a significant uptrend. Pullbacks often represent brief pauses in an asset's upward trajectory, and this term is typically used when these pricing drops are of a relatively short duration - generally spanning just a few trading sessions before the uptrend resumes.
For a novice, pullbacks might appear concerning, but for seasoned traders, these are opportunities to buy. When an asset has had a substantial price increase, a pullback is usually observed as traders take their profits, thus causing a temporary dip in the price. However, this does not typically affect the overall bullish trend of the asset, making pullbacks a potential entry point for those looking to buy in.
Interesting Fact: Pullbacks often occur after traders take profits from a significant price increase, causing a temporary dip in price.
Taking Advantage of Pullbacks: A Tactical Perspective
Pullbacks, by their very nature, provide intriguing entry points for traders. The key is to view these dips as moments of opportunity rather than alarming downturns. Primarily, traders should consider using pullbacks as a moment to make their move when other technical indicators continue to show bullish trends.
This approach revolves around entering the fray during a pullback in a bid to capitalize on the continuing uptrend. Traders can use various types of orders to capitalize on pullbacks, including limit orders or stop entry orders, to enter the market at their preferred price point. Pullbacks can often provide a cost-effective point of entry, allowing traders to optimize their potential profits once the uptrend resumes.
Remember: Traders should use pullbacks as a moment to enter the market when other technical indicators show bullish trends.
Discerning Pullbacks in the Trading Arena
While pullbacks are seen as temporary setbacks in an asset's uptrend, they can tell traders a lot about the asset's current situation and future performance. For instance, after a positive earnings announcement, a stock may see a substantial rise, followed by a pullback as traders sell off their positions to lock in profits. This situation is not indicative of a reversal in the trend, but instead represents an opportunity for new traders to join the trend at a potentially lower price point.
Crucially, understanding the importance of technical support levels in pullbacks is paramount for traders. These levels can include moving averages, pivot points, or Fibonacci retracement levels. When an asset's price dips to these levels before resuming the uptrend, this is indicative of a pullback. However, a breakdown from these levels could signal a reversal, not just a pullback.
Pullbacks in Practice: A Case Study
The true value of understanding pullbacks lies in their practical application within a trader's strategy. A company, for instance, may report impressive earnings leading to a 20% surge in their stock price. After such a significant rise, a pullback could occur the following day as short-term traders sell off their positions to secure their profits. However, this does not necessarily represent a long-term trend reversal. The strong earnings report suggests that the company is on the right track, and buy-and-hold traders could view this pullback as an entry point to the stock at a discounted price.
Looking retrospectively, these pullbacks can seem relatively easy to spot. However, they can be quite challenging to discern in real-time, particularly for investors who are currently holding a depreciating asset.
Tip: Look at moving averages, pivot points, and Fibonacci retracement levels to understand pullbacks better.
Pullbacks Vs. Reversals: Spotting the Difference
Understanding the difference between a pullback and a reversal is crucial for a trader to optimize their strategy. Although both involve a decrease in an asset's price from its highs, a pullback is temporary, whereas a reversal signifies a longer-term change in trend direction. So, how can one tell the difference?
Reversals usually indicate some shift in an asset's fundamental aspects that cause the market to reassess its value. This shift could come in the form of an unfortunate earnings report, a new competitor entering the market, or other impactful events. These occurrences often play out over multiple trading sessions and initially may seem akin to a pullback.
However, traders have tools at their disposal to distinguish between these two scenarios. Moving averages, trendlines, and trading bands are commonly used to identify when a pullback might be morphing into a reversal.
Important: A pullback is temporary, whereas a reversal signifies a long-term change in trend direction.
Caveats to Consider While Trading Pullbacks
Trading pullbacks comes with its own set of challenges. One major hurdle is distinguishing whether a pullback is simply a temporary dip or the beginning of a significant reversal. Traders working on different time frames might perceive the same price action differently; what seems like a pullback for a long-term trader could be viewed as a reversal by a day trader.
To navigate this limitation, traders can use a blend of technical indicators and fundamental data scans to differentiate pullbacks from reversals. Identifying whether a dip is part of a broader market decline or is specific to a particular security is critical. Additionally, observing key technical support levels and checking whether they hold or fail is instrumental in determining whether a dip is a pullback or a reversal.
Tip: Use a combination of technical indicators and fundamental data scans to differentiate pullbacks from reversals.
Tips for Traders: How to Capitalize on Pullbacks
If you want to leverage pullbacks to your advantage, it's crucial first to understand the fundamental factors influencing the uptrend. If no adverse news has impacted the security, it's likely that you're witnessing a mere pullback.
In such a situation, traders can use various orders to establish long positions at relatively cheaper levels. A buy market order can be used for immediate entry, while a limit buy order can be used to wait for even lower prices. If the pullback ends and prices start to rise, a stop buy entry order can be used to enter the market at a level above the current price.
Another important factor to consider is the identification of a potential end to an uptrend or just a pullback. Checking if the fundamental aspects of the security have changed and examining trend and momentum indicators can provide valuable insights. If these indicators signal a potential significant decline, it might be time to reassess your strategy and tighten up your stop-loss order to minimize potential losses.
Fact: A stop buy entry order can be used to enter the market at a level above the current price when prices start to rise after a pullback.
Advanced Techniques for Trading Pullbacks
- Using Fibonacci Retracement Levels: Fibonacci retracement levels are a common tool used to identify potential levels where a pullback might find support. They are calculated by taking two extreme points (a peak and a trough) on a stock chart and dividing the vertical distance by the key Fibonacci ratios of 23.6%, 38.2%, 50%, 61.8%, and 100%. Traders often look to these levels for potential areas of support or resistance where the pullback might end and the trend resume.
- Volume Analysis: In pullbacks, the trading volume usually drops because they are seen as temporary retracements in the context of a larger trend. The lower volume indicates that fewer traders are willing to trade against the overall trend. When the volume starts to increase again, it can be a sign that the pullback is ending, and the primary trend is about to continue.
- Using Oscillators: Oscillators like the Relative Strength Index (RSI), the Moving Average Convergence Divergence (MACD), or the Stochastic oscillator can help traders identify when a security is overbought or oversold within its current trend. For instance, an oversold reading on the RSI during an uptrend might indicate that the pullback is nearing its end and the trend could resume soon.
- Candlestick Patterns: Certain candlestick patterns can provide signals about potential reversals. Bullish patterns during a pullback in an uptrend can indicate that the pullback is ending. For instance, a hammer or a bullish engulfing pattern during a pullback can signal a potential end of the pullback and resumption of the uptrend.
Remember, even with advanced techniques, it's challenging to predict exactly when a pullback will end and the original trend will resume. Hence, risk management and stop loss orders are critical in pullback trading.
Interesting Fact: Oscillators like the RSI, MACD, or the Stochastic oscillator can help traders identify when a security is overbought or oversold within its current trend, which can provide insights about potential end of a pullback.
Tip: An increase in trading volume could be a sign that the pullback is ending, and the primary trend is about to continue.
Staying Ahead of the Curve: Monitoring Economic Indicators and News Events
Beyond technical analysis, traders should also monitor fundamental factors and news events that can impact the security's price. These can include economic indicators, earnings reports, and other news events. Often, the fundamental reasons behind the trend can help traders discern between a temporary pullback and a long-term reversal.
For instance, if a company reports better-than-expected earnings and the stock enters an uptrend, a pullback might just be a temporary pause before the stock continues its uptrend. But if the company reports disappointing earnings or faces a regulatory hurdle, a pullback might be the start of a long-term downtrend.
Remember: The fundamental reasons behind a trend can often help traders discern between a temporary pullback and a long-term reversal.
Pullback Trading: Risk Management
Pullback trading, like any trading strategy, involves risks. Therefore, risk management is crucial. Some key risk management techniques for pullback trading include:
- Stop-Loss Orders: Setting a stop-loss order below the entry point can limit the potential loss if the pullback turns into a reversal.
- Diversification: Diversification across different securities and asset classes can help mitigate risk. If a pullback turns into a reversal, the losses from that security could be offset by gains in other securities.
- Position Sizing: Traders should avoid investing too much in a single trade. Instead, they should use appropriate position sizing to manage risk.
Important: Pullback trading, like any trading strategy, comes with inherent risks, making risk management crucial.
Pullbacks and Reversals Frequently Asked Questions
How can I tell if an uptrend is ending or simply undergoing a pullback?
First, check if there have been changes in the fundamental picture of the underlying security. Next, look at trend and momentum indicators to see if they're turning lower, potentially signaling a more significant decline. If either of these conditions is met, reconsider whether the uptrend has hit a high and tighten up your stop-loss sell order.
What is the difference between a pullback and a reversal?
Pullbacks and reversals both involve a security moving off its highs. However, pullbacks are temporary, and reversals are long-term. Most reversals involve some change in a security’s underlying fundamentals that force the market to re-evaluate its worth.
What are the limitations of trading pullbacks?
The primary limitation of trading pullbacks is that a pullback could be the start of a true reversal. A trader's multisession pullback could actually be a reversal for a day trader looking at the same chart. If the price action breaks the trendline for your timeframe, then you may be looking at a reversal rather than a pullback.
What are some advanced techniques for trading pullbacks?
Some advanced techniques include using Fibonacci retracement levels, volume analysis, oscillators, and candlestick patterns.
How can traders stay ahead of the curve when trading pullbacks?
Traders can monitor economic indicators, earnings reports, and other news events. The fundamental reasons behind the trend can often help traders discern between a temporary pullback and a long-term reversal.
What are some risk management techniques for pullback trading?
Some risk management techniques include setting stop-loss orders, diversifying the trading portfolio, and using appropriate position sizing.
Fact: Leveraging pullbacks effectively in trading requires a comprehensive understanding of both the technical and fundamental aspects of a security.
- Share this article

Matteo Rossi
Matteo Rossi is a seasoned financial expert, proficient in areas of investment strategies, bonds, ETFs, and fundamental analysis. With over a decade in the financial sector, Matteo has developed a keen eye for determining the intrinsic value of securities and deciphering market trends. He specializes in offering sharp insights on bonds and ETFs, with a firm belief in long-term investing principles. Through Investora, he aspires to educate readers about creating a diverse investment portfolio that stands the test of time. Outside the financial realm, Matteo is a passionate classical music enthusiast and a committed advocate for environmental conservation.