
Market Trends and Trendlines: A Comprehensive Guide for Traders
Investora welcomes you to a comprehensive guide on market trends. Our mission is to illuminate the world of trading, taking complex concepts and breaking them down into digestible, actionable information. In this piece, we delve deep into understanding market trends, the different types, their significance in trading, and how to identify and use them effectively. By the end of this article, we hope to equip you with the tools and knowledge necessary to navigate the ever-changing waters of financial markets.
Understanding Market Trends: The Basics
A crucial element of financial trading, whether in stocks, bonds, futures or other market instruments, is the concept of a trend. In its simplest form, a trend signifies the overarching direction of a market or an asset's price. It paints a broader picture of the market movement, shedding light on its general path: up, down, or sideways.
Market trends are often delineated through trendlines, price action, or other technical analysis methods. By examining successive high and low swings, traders can identify an uptrend (higher swing highs and higher swing lows) or a downtrend (lower swing highs and lower swing lows).
Remember: Trends are not foolproof predictors of future market movements. They should be seen as a helpful guide rather than a definitive forecast of where the market is heading.
Significance of Market Trends in Trading
The power of trends lies in their ability to help traders make educated decisions. When the market showcases an uptrend, traders generally aim to go long, betting on the price's continual rise. Contrarily, in a downtrend, traders might short sell, aiming to gain from a potential price drop. Nevertheless, some contrarian traders choose to swim against the tide, hunting for trend reversals or opportunities to trade against the trend.
Trends don't just dwell in the realm of trading; they can also appear in various data types, like monthly economic indicators. Observing data rise or fall consecutively from one month to another can hint at an underlying trend.
Tip: Don't solely rely on trend analysis; instead, use it in conjunction with other trading strategies. This can help in better navigating the market and potentially mitigate risks.
The Trend Anatomy: Uptrends and Downtrends
An uptrend manifests as an overall surge in price, though it's important to remember that no asset price skyrockets indefinitely. The price will undoubtedly oscillate, but the key to recognizing an uptrend is to ensure that the overall direction veers upward. This means that recent swing lows should tower over prior ones, and similarly, swing highs should surpass their predecessors. If this structure starts crumbling, it may indicate an uptrend losing momentum, potentially heralding a downtrend.
Downtrends, on the other hand, are the mirror image of uptrends, defined by lower swing lows and lower swing highs. During a downtrend, traders will typically focus on selling or shorting, aiming to curtail losses or profit from the price drop. Downtrends, while often daunting, do hold a silver lining. As prices continue to plummet, they can attract traders looking for bargain buys, leading to a possible revival of an uptrend.
In contrast to a time of upward or downward movement, periods where the market seems stuck in a horizontal stride, making little to no progress, are called trendless periods or ranges.
Important: All trends, whether uptrends or downtrends, eventually reverse. As such, traders should stay vigilant and adaptable to sudden changes in market direction.
Fundamental Analysis and Trend Examination
Trends aren't just confined to the arena of technical analysis. Fundamental analysts, who base their investment decisions on the overall health and performance of a business, also closely watch trends. They dissect changes in earnings, revenue, and other economic metrics over time, looking for potential patterns or trends.
For instance, if a company's earnings per share have consistently improved over the last four quarters, it signifies a positive earnings trend. Conversely, if earnings have steadily declined over the same period, it points to a negative trend. Thus, trend analysis becomes a powerful tool for investors aiming to make informed decisions.
Interesting Fact: A positive trend in a company's earnings per share over several quarters is usually a good sign and can indicate a healthy financial performance.
Mastering Trendlines: A Crucial Tool in Identifying Trends
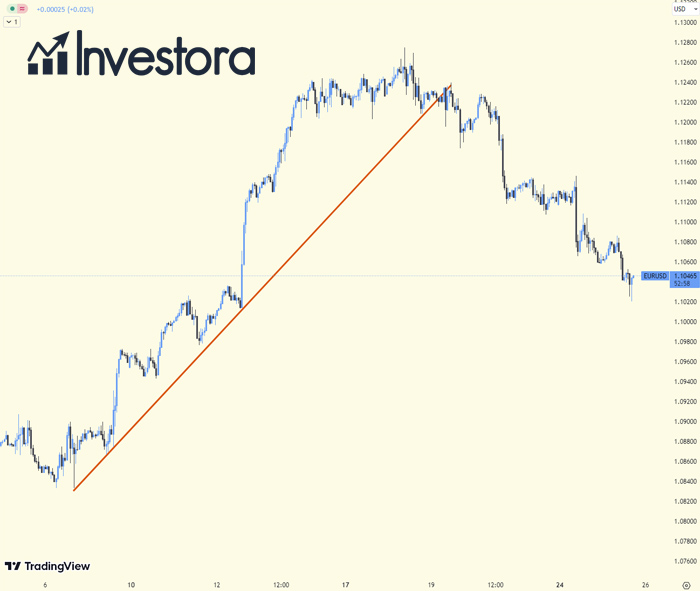
Trendlines are the trader's compass, offering insight into the overall direction of a trend. They connect a series of price lows in an uptrend, forming a line of support, and a series of price highs in a downtrend, crafting a line of resistance. These trendlines not only map out the trend direction but also provide potential future support and resistance levels.
It's worth noting that trendlines aren't fixed. In an uptrend, for instance, the price may temporarily dip below the trendline without signaling an end to the trend. The price could continue its upward journey, requiring the trendline to be redrawn to align with the new price action.
Professional traders usually combine trendlines with other technical indicators and price action to gauge whether a trend is nearing its end. A breach of the trendline isn't necessarily an immediate call to action. However, if it's accompanied by the price falling below a previous swing low and technical indicators turning bearish, it might be time to consider taking action.
Remember: Trendlines, while providing an excellent snapshot of a trend's direction, are not fixed. Prices may temporarily breach these lines without necessarily signaling the end of a trend.
Tip: Always combine trendlines with other technical indicators for a comprehensive understanding of the market trend and potential reversal points.
Trend and Trendlines Frequently Asked Questions
Now that we've painted a broader picture of trends and their role in trading, let's dig deeper and answer some frequently asked questions on the topic:
What makes trendlines a reliable tool in technical analysis?
Trendlines are considered reliable as they help traders visually illustrate the market's direction. They act as lines of support and resistance, providing insight into potential entry and exit points. However, they should be used in conjunction with other technical analysis tools for better accuracy.
How can I draw trendlines effectively?
Drawing trendlines involves connecting either the swing lows in an uptrend or the swing highs in a downtrend. The more times a price touches the trendline without breaking it, the stronger the trendline is considered.
Can trends be identified in all types of markets?
Absolutely! Trends can be identified in all financial markets, including stocks, bonds, and futures. They can also be observed in economic data or even business metrics in the realm of fundamental analysis.
How does recognizing trends aid in trading decisions?
Recognizing trends is crucial as it helps traders align their trading strategies with the market direction. It enables traders to make informed decisions, whether it's going long in an uptrend or shorting during a downtrend.
What signals the end of a trend?
The end of a trend is often signaled by a significant change in price direction. This could include price breaking a trendline, lower swing highs or lows in an uptrend, or vice versa for a downtrend. Changes in related technical indicators can also signal a potential trend reversal.
Interesting Fact: The usage of trendlines extends to various types of financial markets, including stock markets, forex, commodities, and cryptocurrencies. Their utility in identifying potential price support and resistance levels makes them universally applicable.
Market trends hold immense power when it comes to trading and investing. They provide critical clues about the general direction of a market or asset, guiding strategic decision-making and potential profit-making opportunities. Identifying and interpreting these trends can be accomplished through various techniques of technical analysis or fundamental analysis. While trends are a powerful tool, remember that they are part of a broader trading arsenal and should be used in combination with other strategies and methods for maximum effectiveness. By mastering the art of trend analysis, you can better navigate the dynamic landscape of financial markets.
Remember, as with all trading strategies, trend analysis doesn't guarantee success but increases the probability of making more informed and effective trading decisions. At Investora, we provide you with the necessary tools and knowledge to make your journey in trading and investing a successful one. Stay tuned for more insightful articles on various aspects of trading and investing.
- Share this article

Gabriel Kowalski
Gabriel Kowalski is an accomplished trader, financial strategist, and an engaging writer. With over 15 years of experience in forex trading, technical analysis, and the broader financial sector, Gabriel's knowledge is both extensive and versatile. He's known for his astute analyses of market trends and his ability to explain complex financial concepts in an approachable way. His areas of specialization include forex trading, market news, and economic trends. Gabriel's primary aim at Investora is to empower readers with the knowledge they need to make informed financial decisions. When he isn't dissecting financial markets, Gabriel enjoys hiking and photography.